Introduction to Microsoft Clarity Free Heatmap Tool

At the end of October 2020, Microsoft released its eagerly-anticipated visual analytics platform, Clarity. A platform that’s bound to get website owners, Marketing Managers, and CRO specialists excited, Clarity comes with a host of analytics tools completely free of charge.
The GRM team were a little skeptical at how robust this tool would be initially, so we held back in giving our view and recommendations initially. One month down the line, and after putting it through its paces alongside some of the more established analytics tools, here’s what we found...
What is Microsoft Clarity?
Microsoft Clarity is a visual website analytics tool, designed to give you more insight into your website visitors and how they behave. Clarity works on a dashboard interface, allowing you to create reports to further explore interesting segments and behaviours. Reports come in a variety of types including heatmaps and session recordings that give insight into how people are using certain areas of your site that you have installed the Clarity tracking code.
It’s a completely free platform to use, so we’re interested to see how it will evolve in the future. Unlike some of its rival tools such as Crazy Egg and Hotjar, Clarity doesn’t impose any limitations on how many sessions you can record, so we expect this to be a hit with many enterprise businesses.
Key Features of Microsoft Clarity
At the moment Clarity isn’t particularly feature-heavy, although we expect it to be heavily built upon in the near future. The three main tools at the moment are session recordings, heatmaps, and the reporting dashboard.
Session recordings
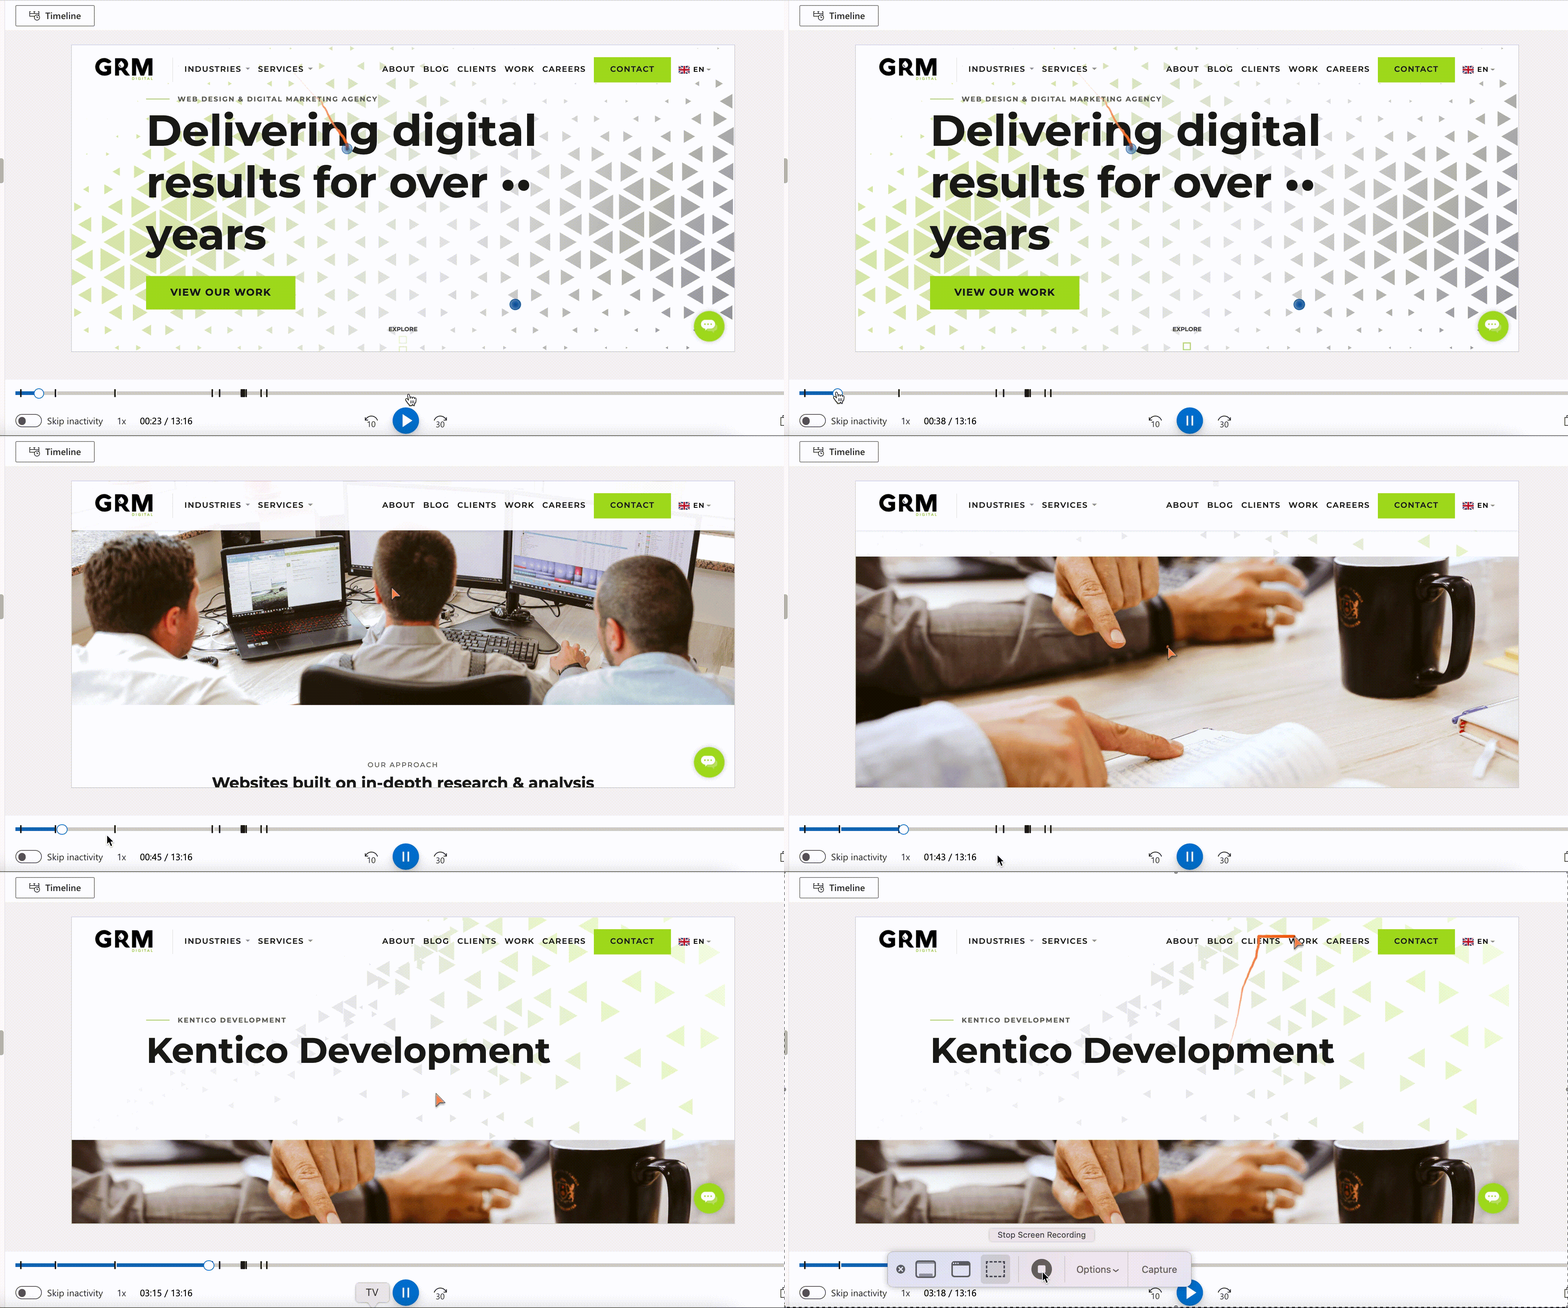
If you’ve never used session recording in your website analytics before, then we recommend you try it out! One of the greatest features of Clarity is its session recording tool, which enables you to watch recordings of your past visitors as they navigate through your website. It’s an excellent way to spot where users may be becoming frustrated or dropping off certain pages.
With each recording, you get a closer look at the user's timeline, where they started on the site, and the pages that they navigate to. You’ll also get data such as the user’s location, device, operating system, and time spent on site.
 GIF showing a user browsing the GRM Digital website and navigating to our Kentico Partner pages.
Heatmaps
Most analytics tools show you what pages people are on and where they come from, but where they often fall down is giving you the understanding of where people are clicking on the page. This is where heatmapping comes in, and we can say that Clarity stands up well to the other solutions that we use at GRM, especially as it is a free heatmap tool.
Clarity’s heatmapping report gives us a clear understanding of the most popular page elements, allowing you to switch between desktop, mobile, and tablet views. At the moment it only displays click data, but you can expect to see scroll maps in the near future.
Reporting Dashboard
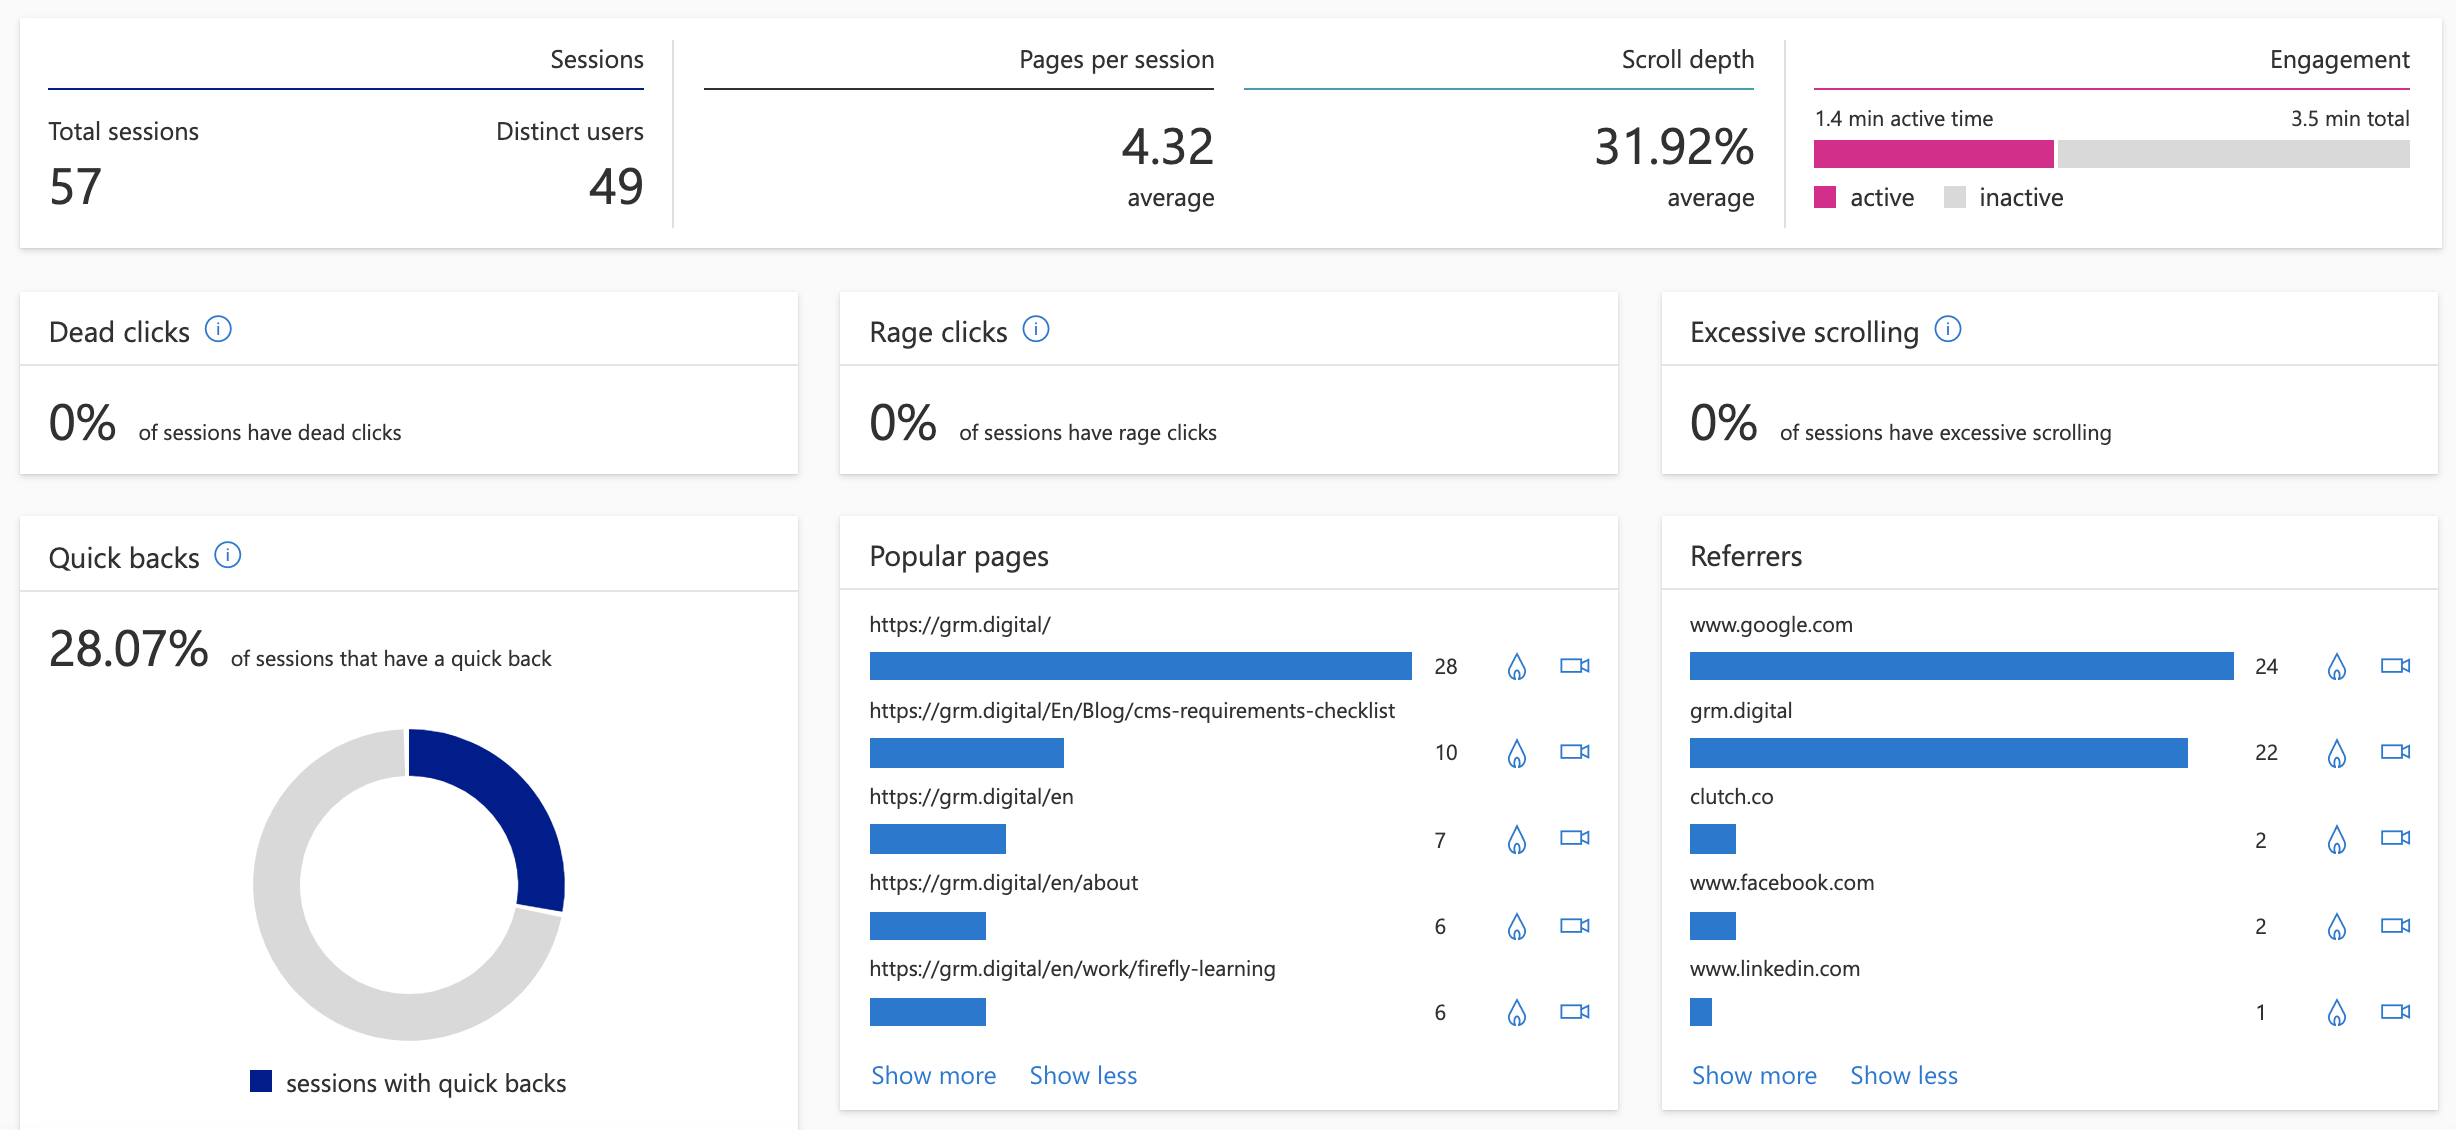
It’s also good to see how Clarity pulls the recording data through to the reporting dashboard and highlights issues. It does this by highlighting records that are considered;
- Quick backs – Users who navigated to a page then quickly returned to the previous one
- JavaScript errors – Users who have experienced JavaScript errors during their session
- Dead clicks – Users clicked or tapped on a page with no effect
- Rage clicks – Users rapidly clicked or tapped in the same small area
Grouping recordings like this help to overcome one of the common challenges with session recording tools; being able to diagnose the extent of problems whilst running through recordings. As a user, it can become easy to watch session recordings without coming to any real conclusion on whether there are problems on your site or not.
By grouping recordings on the dashboard by these four common errors, you gain a quick snapshot of how many users are affected and you can quickly watch the recordings to diagnose the problem.
 An overview of the Microsoft Clarity reporting dashboard.
Does Microsoft Clarity replace Google Analytics?
How far they will take it, we don’t really know, but as this is Microsoft, it could be their first step at taking on Google Analytics. Right now, they are offering completely different tools to GA, focusing more on the visual/CRO side of things, but it wouldn’t be a surprise if they were to include more analytical reports in the near future.
Installing Microsoft Clarity
How do I sign up for Microsoft Clarity?
As we have already mentioned, Clarity is completely free to use, it’s just a case of signing up here, copying the tracking code, and adding it to your website. If you don’t know how, send the code to your digital agency, or add it to the <head> of your site through Google Tag Manager.
